Stroke and Thrombolysis
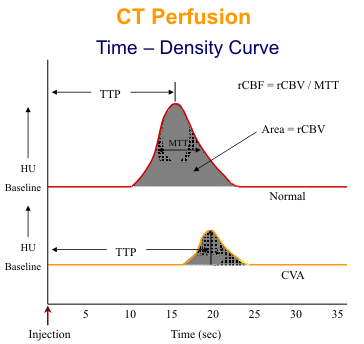
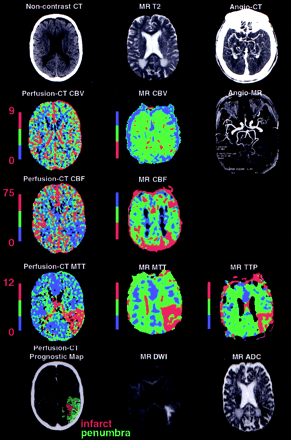
Neuronal function is critically dependent upon blood flow and the brain has an intricate system of controls for maintenance of cerebral perfusion. This system of autoregulation is reflected by the perfusion CT findings in patients with cerebral ischemia. Normal cerebral perfusion (CBF) varies between 45 - 110 ml min-1 100 g-1. A mild reduction (oligemia 20-40 ml min-1 100 g-1) in cerebral perfusion pressure is associated with a compensatory dilatation of cerebral blood vessels. Under these conditions, CT measurements of perfusion remain normal but cerebral blood volume (CBV) and mean transit time (MTT) values are increased. As perfusion pressure falls, perfusion can not be maintained at normal levels despite further vasodilatation. When perfusion (CBF) falls below a threshold of approximately 20 ml min-1 100 g-1, cerebral metabolism is reversibly impaired = ischemia. However, the development of subsequent irreversible damage, i.e. infarction (approximately 10 ml min-1 100 g-1) is also dependent on the time that the tissue has been ischemic as well as the absolute perfusion value. Irreversible damage is associated with loss of the autoregulatory vasodilatation and therefore reduced CBV (values of less than 2.5 ml min-1 100 g-1). Thus, perfusion CT is potentially able to distinguish reversible and irreversible cerebral ischemia not only by demonstrating more markedly reduced perfusion in areas of infarction but also by exhibiting mismatch between CBF and CBV. Reduced CBF with preserved or increased CBV implies reversible ischemia whereas a matched reduction in perfusion and blood volume suggests infarction. Comparison of functional CT images of CBF and CBV images may show regions of mismatch implying reversible changes surrounding a region of apparent irreversible infarction (Figure 1-3). The surrounding reversible region is sometimes referred to as the "penumbra". The mean time-to-peak (TTP) is the time from the start of the scan until maximum attenuation occurs. The mean transit time (MTT) is the time it takes the contrast bolus to pass from the arterial to the venous side of the cerebral circulation. Assuming a symmetrical attenuation curve, the MTT is measured from the first detection of contrast to the maximum attenuation. The entire area under the curve is a measure of relative cerebral blood volume (rCBV). Finally, a measure of relative cerebral blood flow (rCBF) is calculated by dividing the rCBV by the MTT. CBF proves equal to the CBV-to-MTT ratio.

|
 [in a new window] |
Figure 2. A 51-year-old male patient with sudden onset of a right face-arm-leg motor hemisyndrome associated with fluent aphasia 1.5 hours before admission. Noncontrast brain CT and perfusion CT were obtained 1.75 hours after symptom onset, whereas DWI or PWI was performed 20 minutes after CT. Noncontrast brain CT showed left insula ribbon sign. Sizes of cerebral infarct and CBV abnormality on perfusion CT (mL/100 g) is similar to that of DWI abnormality, whereas MR CBV map is unremarkable. Sizes of cerebral ischemic lesion and CBF/MTT abnormality on perfusion CT [(mL · 100 g-1 · min-1)/s] correlate with that of MR MTT abnormality (red) located on the left temporoparietal region, whereas they are larger than those of MR CBF and TTP abnormalities (red). CT-angiography and MR-angiography demonstrate occlusion of the left M1-M2 junction. This patient underwent successful thrombolysis with significant regression of symptoms. |
 [in a new window] |
Figure 3. A 63-year-old woman patient with sudden onset of a right face-arm-leg hemisyndrome associated with nonfluent aphasia. Noncontrast brain CT/perfusion CT and DWI or PWI were performed 2 and 2.3 hours after symptom onset, respectively. Noncontrast brain CT demonstrates left insula ribbon sign and left parietal hypodensity. MR CBV map is normal. Brain infarct and CBV abnormality on perfusion CT (mL/100 g) show sizes similar to that of DWI abnormality. Brain ischemic lesion and CBF MTT abnormality on perfusion CT [(mL · 100 g-1 · min-1)/s] and MR MTT abnormality (red) involve the whole left MCA territory, relating to an M1 occlusion on both CT-angiography and MR-angiography. This patient underwent unsuccessful thrombolysis.
|
Positive identification of ischemic stroke with perfusion CT is readily performed using the perfusion or transit time images. It may be clinically useful to distinguish between a completed stroke and transient ischemic attack (TIA) and occasionally the clinical presentations of stroke. Normal perfusion and mean transit time (MTT) imply a TIA whereas a stroke is seen as a localized area of reduced perfusion and increased MTT (Figure 1-3).
The size of the perfusion abnormality in acute stroke can provide an indication of prognosis. However, perfusion CT at present is most widely performed using a single or dual slice technique with the chosen slice level passing through the basal ganglia so as to include the vascular territories of the carotid branches that are most frequently affected by thrombosis. Although major ischemic events will be seen within this slice, it should be remembered that small areas of ischemia lying outside the slice would not be detected, e.g. cerebellar infarcts. Similarly, the extent of infarction may be underestimated.
The ability of perfusion CT to identify areas of salvageable brain tissue (=penumbra) indicates a potential role in identifying patients most likely to benefit from thrombolytic therapy aimed at reversing or minimizing ischemic brain damage. Patients with completed infarction only, as indicated by matched reductions of perfusion and blood volume on perfusion CT, could be saved the risks associated with treatment, whereas patients with perfusion/blood volume mismatch implying reversible damage, would be well suited for therapy.
Perfused-blood-volume CT perfusion images have also shown promise for predicting which patients are likely to experience cerebral hemorrhage after thrombolytic therapy. In one preliminary investigation, 80% of patients with acute middle cerebral artery stroke who were treated with thrombolysis and who had a greater than 8 H difference between normal and maximally ischemic hypodense tissue on perfused-blood-volume CT perfusion progressed to hemorrhage, whereas 80% of those with a less than 8 H difference, did not.